
सीखें : Trade Anil Says
Fundamental Analysis
MTF Analysis
HTF : (D) Time Trend
- Check the Dollar index on top-down analysis
- Choose your assets and start from HTF
- Structure
- Wick = Rejection ( SL Hunt )
- Mark Internal / External Liquidity
- Mark OB With Inefficiency
- Fake Out / Break Out
MTF : (4H/1H) Order Flow Liquidity
- Look for daily bias on the daily timeframe
- Look for market direction on 4HTF with the help of BOS&CHOCH
- Find Order Flow
- Mark Fib : Retracement / Break
LTF : (15M/5M) Take Entry
- Try to take the trade in 4 H direction
- Draw your entry zone, based on your trading setups
- Wait till the price enters into your zone
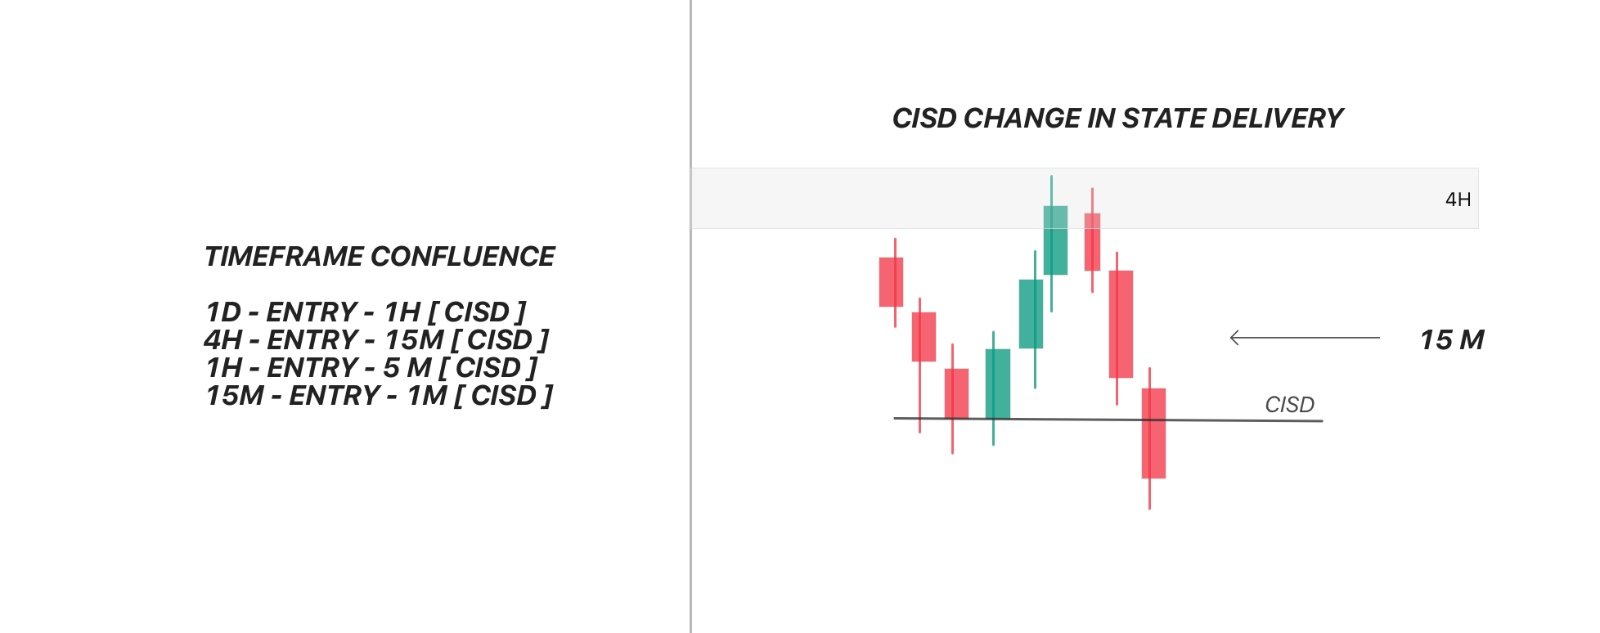
- Look for CHOCH/MSS/CISD on LTF. [1H-15M/15M-5M]
- Also Check Valid CHOCH (After Liquidity Sweep) : 5m / 15m > 1 H
- Also Check For Time Manipulation in MTF : 5m / 15m > 1 H
- No CHOCH/MSS/CISD No trade
Pre Setup
Capital = $1000
- Always Take Mini Lot = 0.1 ( $1 / Pips)
- Risk Per Trade SL = 10 Pips (-10 $)
- Profit Per Trade TP = 20 Pips to 60 Pips (20$ – 60$)
Important
- Do Not Trade More Than $100
- Stop After 2 Loss / day
Day 1 : Candle Range Theory
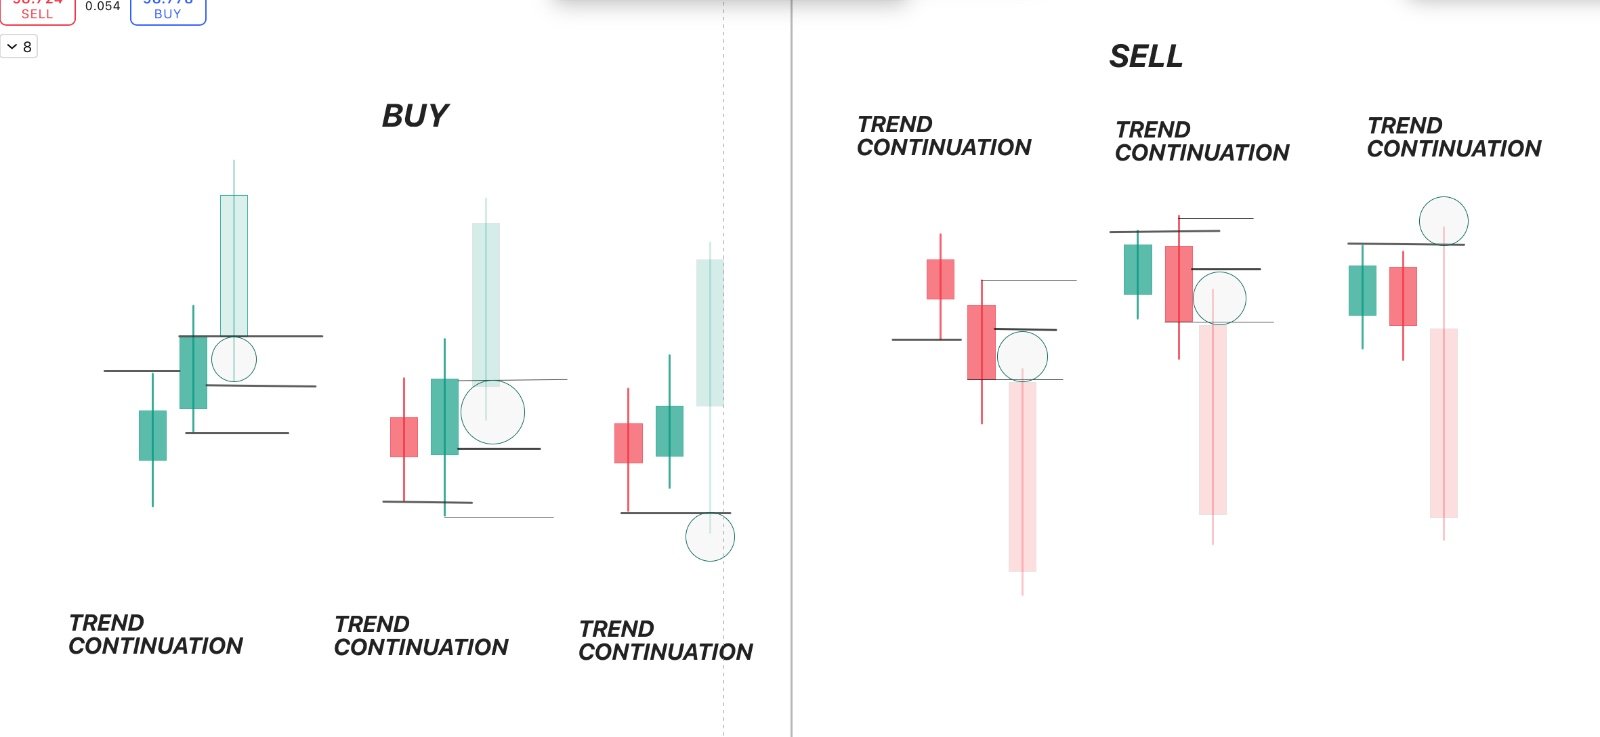
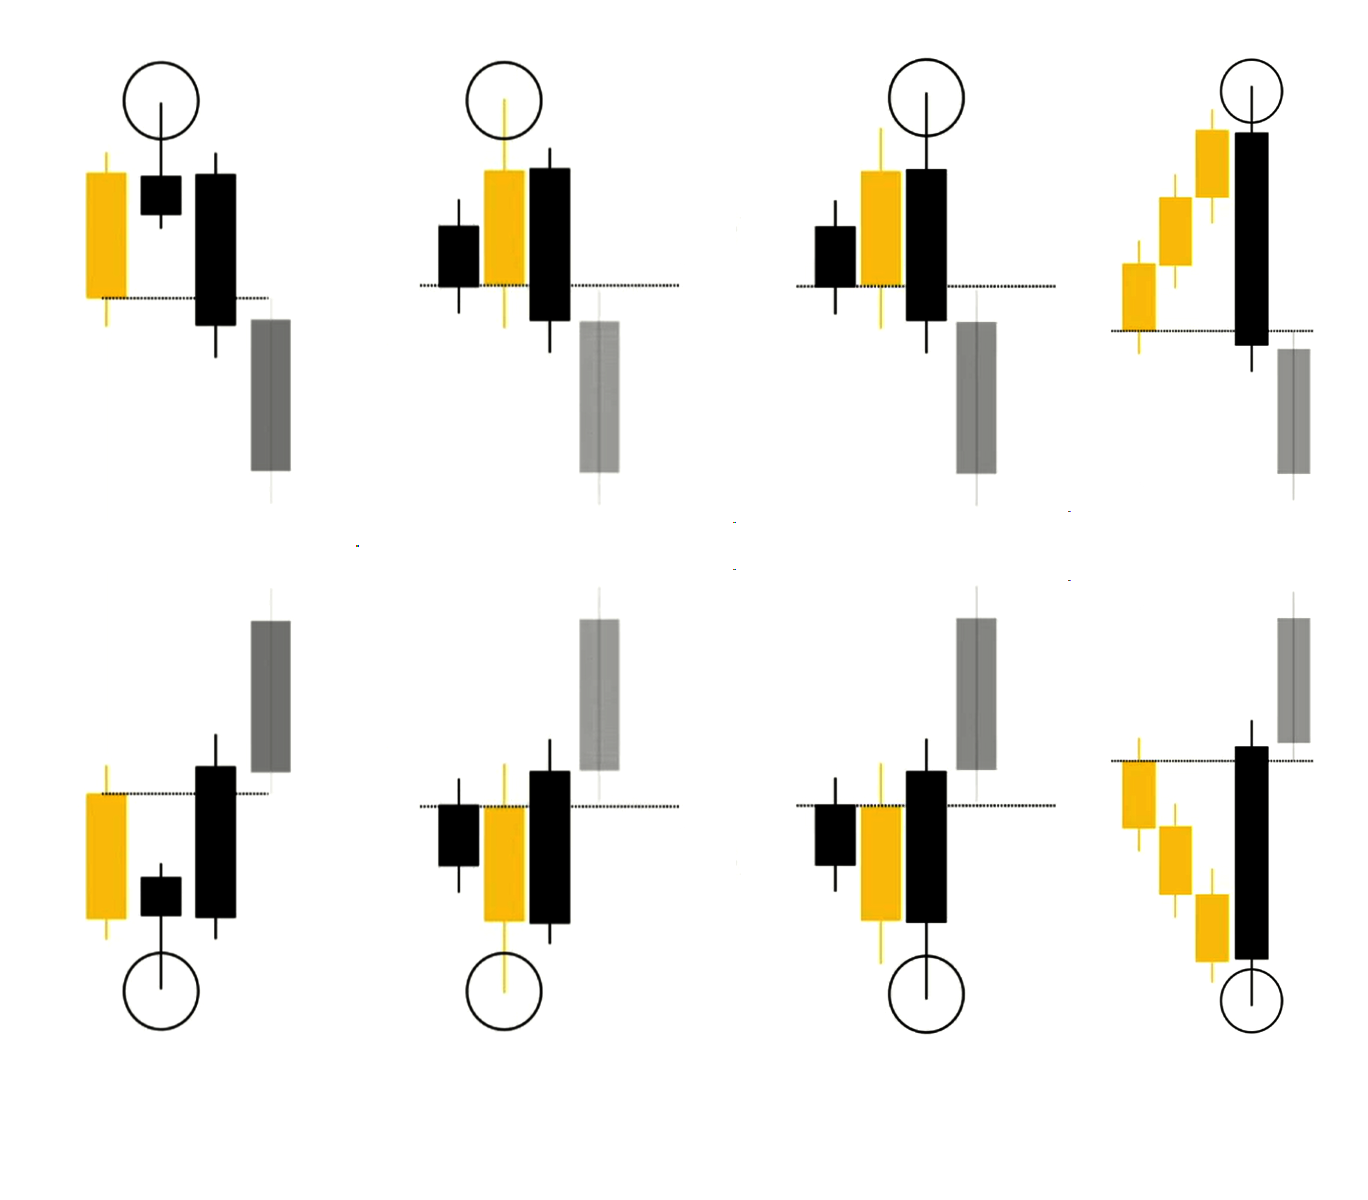
Best Strategies
60 / 15 Trade
Start with 1H Timeframe
- Search ERC for Direction
- Candle Body 60 % ? 🔴🟢
- Candle Color ? 🔴🟢
- Closing Price Break Previous ? 🔴🟢
- Rejection Wick ? 🔴🟢
- Search NRC for Direction
- See Closing Price ? 🔴🟢
- Limit = Close Price of Closed Candle
- TP = Shadow of Closed Candle
Shift to Lower Timeframe 15m
Use Small Lot Size
Equal High / Equal Low
Start with 1H Timeframe
- Look for Double Top / Triple Top
- Draw Horizon Ray in From Wick of Double Top’s Low
- R:R = 1:2
LuxAlgo - Trendlines with Breaks
Start with 1H Timeframe
- Set Indicator and wait for Break
RSI Divergence
Switch to Line Chart
- Look for Bullish / Bearish Divergence
- Draw Confirmation Line = Trend Line
- Draw / Look for Price Action
- Look for Previous Support & Resistance / Demand & Supply
- Look for Candlestick Pattern
- Trade after liquidity grab
Fibonacci Level
Look for Correction and use Fibonacci
- Wait price to penetrate between 50% & 61.8%
- Draw key level ( Support Resistance / Demand Supply )
- Find area of value Using
- Trend line
- EMA 50
- SMA 200
- Price action
- S & R
- Pivot Points
Protected Swing
Start With HTF > 1H
- HTF Search For Protected Swing With 3 Candles
- Swing Must Be Rejected From Any Entry Level
Shift to LTF
- Look For MSS / Valid CHOCH
- Look For FVG
Liquidity Sweep
Start with HTF
- Search For Liquidity Sweep
Shift to LTF
- Wait for MSS
- Look For FVG
Session By Session
Start with HTF [1H]
- Start Just Before Every New Session
- Mark High and Low of 1HR Candle Before Session
Shift to LTF [5m]
- Wait for Liquidity Grab
Shift to LTF [1m]
- Look for MSS
- Look For CHOCH / MSS
- NO CHOCH NO TRADE
- Take Entry R:R = 2
DXY VS XAU
Start with HTF [1H]
- Start Just Before Every New Session
- Mark High and Low of 1HR Candle Before Session
Shift to LTF [5m]
- Wait for Liquidity Grab
Shift to LTF [1m]
- Look for MSS
- Look For CHOCH / MSS
- NO CHOCH NO TRADE
- Take Entry R:R = 2