
Table of Contents
सीखें : Trading ( SMC )
Technical Analysis
- Day 1 : Introduction
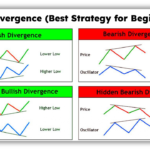
- Traders look for these patterns to understand the true market direction, aiming to enter trades at optimal price points (like after a pullback to an Order Block/FVG) with favorable risk-to-reward ratios, essentially trading with the big players.
- Market Structure (BOS/CHoCH): Tracking Breaks of Structure (BOS) to confirm trends and Changes of Character (CHoCH) to spot potential reversals.
- Liquidity: Identifying areas (like old highs/lows) where stop-losses are clustered, which institutions often target to fill large orders (liquidity grabs).
- Order Blocks (OBs): Zones where institutions likely placed large orders, acting as potential reversal or entry points.
- Fair Value Gaps (FVGs): Imbalances in price movement (voids) that price often returns to fill.
- Institutional Footprints: Patterns like sudden price displacement or accumulation/distribution zones that reveal big player activity.
- Traders look for these patterns to understand the true market direction, aiming to enter trades at optimal price points (like after a pullback to an Order Block/FVG) with favorable risk-to-reward ratios, essentially trading with the big players.
- Day 2 : Swing High & Swing Low
- Swing High : Set of minimum 3 Candlesticks (Center candle upper than other two)
- Swing Low : Set of 3 minimum Candlesticks (Center candle lower than other two)
- Day 3 : Trend Theory
- Uptrend Trend : Continuous HH & HL / Same Up Pattern
- Downtrend Trend : Continuous LH & LL / Same Down Pattern
- Sideways Trend : in Between H & L / No Similar Pattern
- Day 4 : Liquidity Sweep
- Search For Consolidate
- Search for Fake Breakout & Fast Movement
- Day 5 : Break Out & Fake Out
- Breakout (Quick Rule)
- 1st Candle, R के ऊपर
- 2nd Candle, 1st के ऊपर Trade
- 2nd Candle, R के ऊपर close
- Note : Breakout Candle से Swing Low / Swing High, Immediate नहीं बनना चाहिए
- Fake Out (All Other) Fake Out / Stop Hunt / Liquidity Sweep / SMC ने की Entry : बाकी सारे Combination
- Immediate Fake out : Best Probability
- Wick : Good Probability
- Rounded Fake Out : OK Probility
- Breakout (Quick Rule)
- Day 6 : Change Trends
- Note :
- पिछला High / Low से Direction को ही Trend माना जाए
- पिछला High / Low break होने के बाद Trend Shift माना जाए
- 50% Correction के बाद ही New High / New Low Consider करना है
- कभी भी Fake out हो = Indecision Condition होगी
- Uptrend के बाद 2 बार Low Break कर दे : Downtrend की संभावना
- Downtrend के बाद 2 बार High Break कर दे : Uptrend की संभावना
- अगर High और Low के बीच रहे (Breakout न करे) / नया High Low नहीं बने तो : Sideways और उसके बाद Next Trend
- Fibonacci का Secret Level = 0.702 ( Premium Zone / Discount Zone )
- Note :
- Day 7 : BMS & SMS View Video
- Break BMS = Fake Out + Breakout
- Note : यह High Probability Setup है, Fake Out अनिवार्य होगा + Previous High/Low को सीधे Break करेगी
- Note : Continuation Trend में Break BMS : Fake Out + Break Out BMS का मतलब हमेशा Reversal नहीं होता
- Shift SMS (Smooth Shift) = Break Out + 2 Structure Shift
- Note : Low Probability (Fake out नहीं इसलिए Liquidity Sweep Confirm नहीं होता)
- Break BMS = Fake Out + Breakout
- Day 8 : Liquidity Pool जहां अधिकतर लोग Stop Loss लगाते हैं और जिसे SMC, टारगेट करते हैं
- L : Last Sessions & News : Day/Week High & Low / News & Event
- I : In-Efficiency
- Opening Gap
- Order Block
- FVG
- Breaker
- Q : Quadrilateral : Rectangular Consolidation
- D : Double Top/ Double Bottom (Relative Equal Low / High)
- T : Trend Line & Retailer Pattern
- Retailer Pattern
- Bull Flag / Bear Flag
- Bullish Pennant (Rectangle)
- Day 09 : Order Type & Stop Loss Resistant
- Order Type
- Limit Order
- Stop Limit Order
- Buy Stop
- Sell Stop
- Stop Loss
- LRLR (Low Resistant Liquidity Run):
- HRLR (High Resistant Liquidity Run) : Fake Out (Liquidity Absorbed) हो चुका हो (Double Top, 3 Drive Pattern) to यहाँ Stop Loss लगाओ
- Order Type
- Day 10 : Order Block Theory View Video
- नीचे +OB / Bullish Order Block : Last Selling Candles Before Up = Demand Zone
- ऊपर -OB / Bearish Order Block : Last Buying Candles Before Down = Supply Zone
- दोनों को टेस्ट करने आता है price
- Order Block Type
- Primary = at Reversal
- Secondary = in Continuation
- Condition
- Swing Low / Swing High के पास Fake Out (Liquidity Sweep) के साथ +OB / -OB = High Probability
- Fake Out के बाद +OB / -OB के बाद BOS (BMS/SMS) बना हो = High Probability
- +OB, Discount Zone में हो और -OB, Premium Zone में हो = High Probability
- Entry Plan : View Video
- Single Candle : High से Mid
- Multiple Candle : तीनों Candle की body से Mid
- Day 11 : Fair Value Gap (FVG) : View Video
- Strategy
- किसी भी कलर की 3 Candles के बीच Fair Value Gap बनता है जिसे Price, Fill करने वापस आता है
- सभी Value Gap Fill नहीं होते
- Bullish FVG = Support की तरह
- Bearish FVG = Resistant की तरह
- Entry Setup in Rectangle
- Entry : Top to Mid
- Stop Loss : Bullish में 1st Candle के नीचे , Bearish में Top Candle के ऊपर
- High Probability FVG
- Fake Out / Liquidity Sweep के बाद
- FVG के बाद BMS/SMS बना है
- +Bullish FVG, Discount Zone में हो , -Bearish FVG, Premium Zone में हो
- 1st Test में High Probability
- Strategy
- Day 12 : Breaker Block Candle View Video (OR = Failed Order Block, अगर Momentum है तो High Probability )
- Fakeout होने के बाद BMS बने
- BMS के बाद तेजी से Movementum हो
- Fakeout करने से पहले Last Opposite Candle आए, 2 3 हो तो जो Highest हो वो Breaker Block है
- इसी Breaker को Price Test करने आता है, Target : Liquidity Pools
- अगर Liquidity Sweep + एक तरह की candle से High Momentum = Higher Probability
- Entry Setup
- Entry : Top to Mid of Breaker
- SL : BODY ke Niche ya Liquidity Pool
- Day 13 : Types of Liquidity (Moving the Price)
- Dealing Range : Genuine Low & Genuine High के बीच
- Internal Range Liquidity (IRL)
- External Range Liquidity (ERL)
- Market हमेशा IRL से ERL को बनाता एवं Absorb करते हुए चलता है
- Liquidity Pools
- Inefficiency (Opening Gap, Breaker, FVG, OB)
- Day 14 : Strategies & Multiple Time Frame ( MTF ) Analysis
- Single Time Frame Strategy
- Bread Butter Strategy
- EMA Strategy
- Bollinger Bands
- 3 Drive
- Multiple Time Frame ( MTF ) Analysis
- High Time Frame : Trend ( i.e. Trend + OF + Execution ) So, High Time Frame is Always King
- Low Time Frame : Order Flow जहां price जाना चाहता है / Secondary Trend ( i.e. OF + Execution )
- Small Time Frame : Trade Setup ( i.e. Execution )
- High Probability, if High TF & Low TF is Same Direction
- Single Time Frame Strategy
- Day 15 : Top to Down Analysis (HTF>LTF>STF)
- Overview
- 150 – 200 Candlesticks
- 9-12 Month
- Analyze From High Price Trend (1d > 1h > 15m > 5m)
- Primary Trend ( is Boss )
- Secondary Trend
- Tertiary Trend
- Find Dealing Range
- Key Swing High & Key Swing Low = External Liquidity Sweep या Create की हो
- Market Structure
- Discount Zone और Premium Discount में Mark करो (Swing Low, EQL, OG, BR, FVG, OB, Swing High)
- Find & Mark Fibonacci Premium & Discount Zone
- Internal Liquidities / Inefficiencies / Liquidity Pools
- Analysis करते समय Dealing Range के बीच में रहें
- Overview
- Day 16 : Entry Techniques
- सबसे पहले Preparation करके Watch लिस्ट बनाएं
- Mark in High TF
- Find Liquidity Sweep Done
- Find Confirmation ( BMS / SMS )
- Entry Technique
- Premium Discount Zone
- Fibonacci Golden Zone
- Breaker / OB / FVG : जो पहले आया उसे Entry करो , सबसे लास्ट SL के लिए
- Other Strategy ( EMA, Opening Gap)
- सबसे पहले Preparation करके Watch लिस्ट बनाएं
- Day 17 : Risk Management
- Day 18 : Emotional Management
- Day 19 : Swing Trading
- Day 20 : Intraday Trading
- Day 21 : Opening Gap Strategy
- Day 22 : FVG Strategy
- Day 23 : Inducement Traps
- Day 24 : Sideways Strategy
Steps to Follow
- Search Rapid Move Followed by Consolidation
- Mark Previous High & Low
- in Case BMS (Fake Out + Break High) : Search for Retest & Buy
- in Case : SMS (No Fake Out + 2 Break High) : Search for Retest & Sell
- Find Reversal Confirmation
- Find Liquidity Sweep
- Absorption : Pump Then Small/Slow/Wicky/Not Continuation Move
- Trade : Reversal Trade with Wicky Trade
- Structural Break : SMS
- Volume Trap Pattern :
Pending Next
- Swing High : With 3 Candles, Middle Candle Up Side
- Swing Low : With 3 Candles, Middle Candle Down Side
- BreakOut : Deside With 2 Candle Sticks ( High Trade + Up Close )
- FakeOut : All Others
- BMS : FakeOut + Break High
- SMS : No Fakeout + 2 Break High
- Search For Liquidity Pools / In-efficiencies
- Search For
- Big Candle = Liquidity Sweep
- Search For HRLR & LRLR / 3 Drive Pattern ( Triple High )
- Liquidity Pools Terms
- Opening Gap :
- Order Block (Fast Pump) :
- + OB : Last Sale Before Pump : Only Touch Karne aata Hai
- – OB : Last Buy Before Sale : Only Touch Karne aata Hai
- Important :
- Liquidity Sweep हो जाने के बाद Low Probability OB बनता है
- Liquidity Sweep हो जाने के बाद High Break किया हो / BOS बना हो
- Premium & Discount Zone
- FVG :
- Breaker :
- Search For
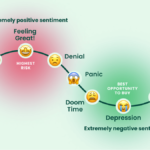
Psychology
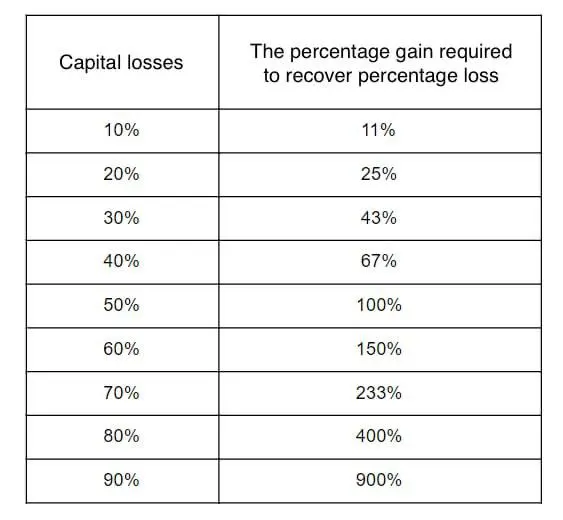
- Capital Protection
- Trade : 80:20 Rule
- Find Capital Part to Trade = 2%
- Risk Formula = Fund * Risk % / SL%
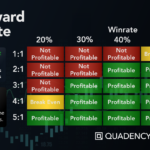
- Find Risk to Reward Ratio RRR > 1:1 Use Short / Long Tool
- Fix Win Rate > 40%
- Emotion Control
- Swing / Investing : GTT
- Daily Fresh Start
- During Trade
- Feel Every Trade as Lottery
- Discipline : Faith on Your Planning
- Money Management + Risk Management + Planning
- Swing Trading ( Swing to Swing Trading )
- Monthly TF > Weekly TF > Find Liquidity > Day TF
1
2
3
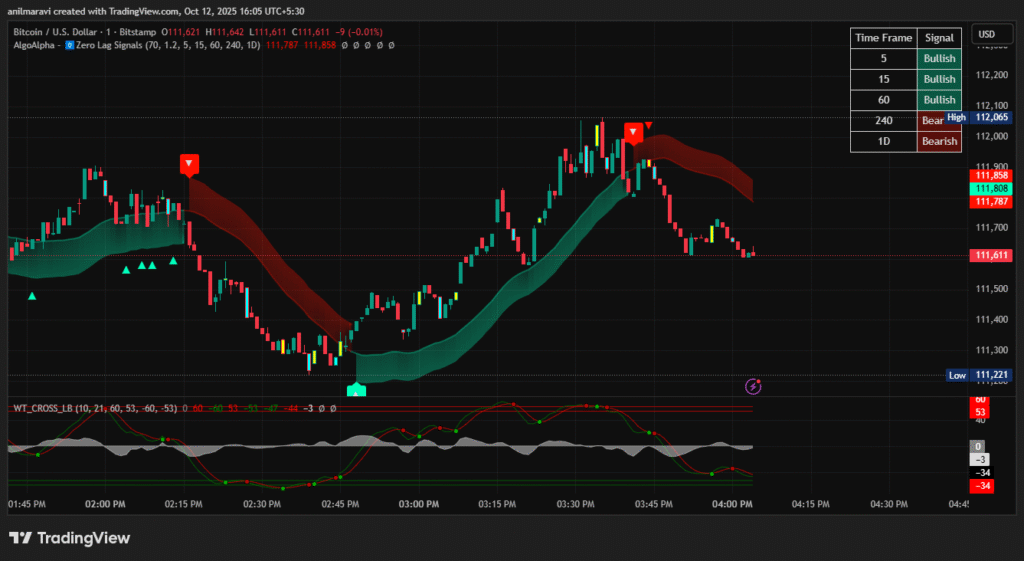
Setup For NIFTY
TRADING VIEW
- Add Indicators
- Algo Alpha Zero Lag Signals
- Watch Time Frames (Right Corner)
- If Touch Candlesticks (Bullish / Bearish Wave)
- Wave Trend Crossby Lazy Bear
- View Over Bought / Over Sold
- Algo Alpha Zero Lag Signals
- इन्डेक्स के हीट map को देखें
- Nifty VIX :
- High Volatility : 15-20
- Sideways : 5-7
- Analyze Support / Base Line
- Take Input from Haldhar – Down or Up ?
- Watch ESMA / ZSLMA Line
1
अगर वेव ट्रेंड बुलिश है
- ग्रीन वेव के नीचे सेल की लिमिट लगाओ
- ग्रीन वेव के ऊपर या पिछले कैन्डल की लंबाई जितनी स्टॉप लॉस लगाओ
अगर वेव ट्रेंड बियरीश है
- रेड वेव के नीचे buy की लिमिट लगाओ
- रेड वेव के ऊपर जितना ही या पिछले कैन्डल की लंबाई नीचे स्टॉप लॉस लगाओ
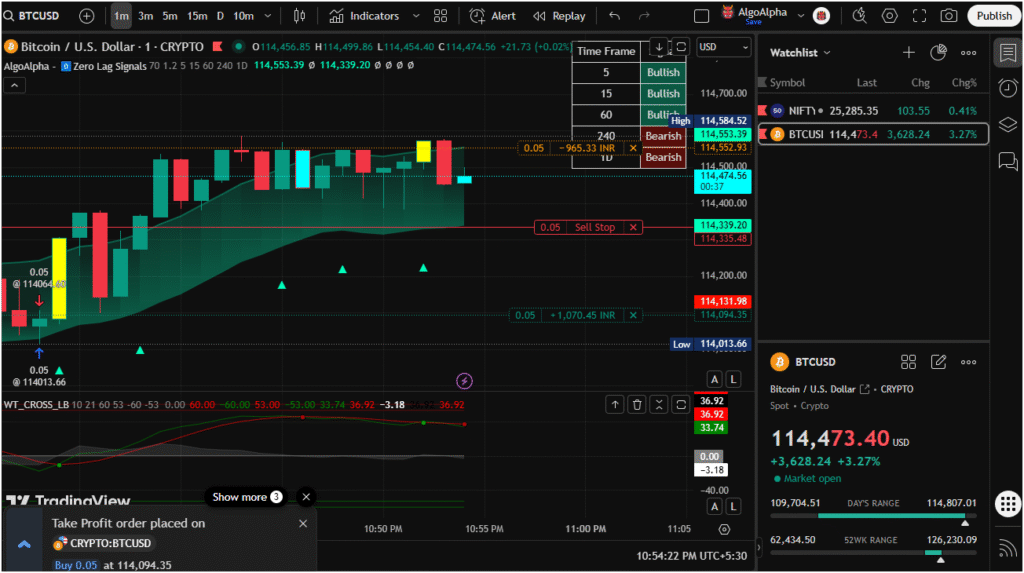
STEPS FOR CRYPTO
Indicator
- Alligator
- Buy After Wave & Alligator Cross Cut
Wave Signal
- खतरे के निशान से ऊपर Buy : ST Red Width Jitna
- ग्रीन सिग्नल के नीचे Sale : ST, Green Width Jitna
List of Stock Exchanges in India
| क्रमांक | स्टॉक एक्सचेंज का नाम | ट्रेडिंग समय (भारतीय समयानुसार) | मुख्य विशेषताएँ | न्यूनतम निवेश राशि |
|---|---|---|---|---|
| 1️⃣ | BSE (Bombay Stock Exchange) | सुबह 9:15 से दोपहर 3:30 बजे तक (सोम–शुक्र) | एशिया का सबसे पुराना एक्सचेंज (1875), 5000+ कंपनियाँ लिस्टेड, Sensex इसका प्रमुख सूचकांक है | ₹10–₹100 से भी शुरू कर सकते हैं (ब्रोकरेज पर निर्भर) |
| 2️⃣ | NSE (National Stock Exchange) | सुबह 9:15 से दोपहर 3:30 बजे तक (सोम–शुक्र) | भारत का सबसे बड़ा वॉल्यूम एक्सचेंज, Nifty 50 इसका प्रमुख सूचकांक, पूरी तरह इलेक्ट्रॉनिक ट्रेडिंग सिस्टम | ₹10–₹100 से शुरू कर सकते हैं |
| 3️⃣ | MSE (Metropolitan Stock Exchange of India) | सुबह 9:15 से दोपहर 3:30 बजे तक | नए निवेशकों के लिए वैकल्पिक प्लेटफ़ॉर्म, छोटे व मध्यम उद्यमों (SMEs) के लिए भी उपयुक्त | ₹100–₹500 से शुरू किया जा सकता है |
| 4️⃣ | India International Exchange (India INX) (Gift City, Gujarat) | 22 घंटे ओपन (रात 8:00 बजे से अगले दिन शाम 6:00 बजे तक) | भारत का पहला अंतरराष्ट्रीय एक्सचेंज, विदेशी निवेशकों के लिए डिज़ाइन किया गया | डॉलर आधारित ट्रेडिंग, ₹1000 या $10 से लगभग प्रारंभ |
| 5️⃣ | NSE IFSC (NSE International Exchange) (Gift City, Gujarat) | 22 घंटे ओपन (रात 8:00 बजे से अगले दिन शाम 6:00 बजे तक) | ग्लोबल स्टॉक्स, ETFs, और डेरिवेटिव्स ट्रेडिंग प्लेटफ़ॉर्म | $1 से भी शुरू किया जा सकता है (लगभग ₹80) |
| प्रकार | विवरण |
|---|---|
| प्री-ओपन सेशन (BSE/NSE) | सुबह 9:00 से 9:15 बजे तक (ऑर्डर लगाना और प्राइस सेट होना) |
| नॉर्मल ट्रेडिंग सेशन | सुबह 9:15 से दोपहर 3:30 बजे तक |
| पोस्ट क्लोज़ सेशन | 3:30 से 4:00 बजे तक (ऑर्डर संशोधन, क्लोज़िंग प्राइस तय होता है) |
पैसे कमाने के कितने तरीके हैं ?
- IPO Listing में Pre Invest करके
- Long Time Investing
- Trading
- Intraday Trading x 5
- Option Trading (Derivatives)
- Future Trading
- Swing / Positional Trading
- Mutual Fund Invest
- ETF Exchange Trading Fund
- Comodity
Forex Trading
1 – 100 : Large Cap Companies
- In terms of market capitalization, these companies are at the top.
- These companies are established and are highly valued.
- These have low risk and are stable.
101 – 250 : Mid Cap Companies
- In terms of market capitalization, these companies are ranked from 101st to 250th.
- These companies are bigger than small cap companies and smaller than large cap companies.
- These carry medium risk and have growth potential.
251 – Above : Small Cap Companies
- In terms of market capitalisation, these companies rank above 251.
- These companies are emerging and have higher risk.
- These can potentially provide higher returns.
Investment और Trading में अंतर
| Investment | Trading | |
|---|---|---|
| समय-सीमा | लंबी अवधि | अल्पकालिक |
| उद्देश्य | दीर्घकालिक धन संचय ( 1 वर्ष से कई वर्ष) | अल्पकालिक लाभ कमाना (1 दिन से लेकर 1 माह ) |
| रणनीति | कंपनी की विकास संभावनाओं पर ध्यान देना | बाज़ार के उतार-चढ़ाव का फ़ायदा उठाना |
| प्रक्रिया | स्टॉक या अचल संपत्ति खरीदकर रखना | स्टॉक, मुद्रा, या कमोडिटीज़ खरीदकर बेचना |
तरलता
लीगल
एक्सचेंज
IPO क्या है ?
तरलता
तरलता या लिक्विडिटी
- किसी परिसंपत्ति को आसानी से नकदी में बदलने की क्षमता. तरलता किसी भी वित्तीय बाज़ार का एक ज़रूरी पहलू है.
- परिसंपत्ति की मांग ज़्यादा = ज़्यादा तरलता।
- मापन विधियाँ
- बाज़ार तरलता
- लेखा तरलता.
- तरलता की कमी = अतरलता
- गैर-वर्तमान परिसंपत्तियां सबसे कम तरल परिसंपत्तियां होती हैं
- मार्केट में Buyer & Seller हमेशा Available रहते हैं
लीगल
Legal
- SEBI : Securities and Exchange Board of India : प्रतिभूति और वित्त बाज़ार नियामक बोर्ड है. इसकी स्थापना 12 अप्रैल, 1988 को हुई थी. इसका मुख्यालय मुंबई में है.
- यह भारतीय प्रतिभूति बाज़ार को नियंत्रित करता है.
- यह निवेशकों के हितों की रक्षा करता है.
- यह बाज़ार में पारदर्शिता बढ़ाता है.
- यह बाज़ार को सुचारू रूप से चलाने के लिए नियम और विनियम बनाता है.
- यह बाज़ार में सभी संस्थाओं पर नज़र रखता है.
- यह धोखेबाज़ों को दंडित करता है.
- यह निवेशकों के लिए दिशानिर्देश बनाता है.
एक्सचेंज
Exchanges
- NSE :
- Index : Nifty Fifty = 50 Company
- Listed Company : 5505
- एनएसई में तरलता ज़्यादा है.
- BSE : Index : Sensex : 30 Company
- Total Company : 2379
IPO क्या है ?
To Participate in IPO
- You must be an Indian resident.
- You should have a demat account.
- You must have sufficient funds in your account to purchase IPO shares.
- You should have a PAN card.
- You must be above 18 years of age.
- You must be legally able to enter into contracts.
- You should have a Permanent Account Number issued by the Income Tax Department and a Demat account.
IPO Vs Loan
- Loan : Pay Interest to Banks
- IPO : No Interest (Open to Public)
Eligibility requirements for a company issuing an IPO
- The company should have a paid-up equity capital of at least Rs 10 crore.
- The company should have submitted the annual report of the last three years to the National Stock Exchange (NSE).
- The net worth of the company should not be negative.
Technical Analysis Concept
Trick & Tips
Nifty50
- Target 1:2 रखना
- 100 Points Movement > Hammer > Change Trend = Stoploss : Hammer End
- Bullish Engulfing
- in Bottom : Chance 95 %
- in Top : Don’t Trade